HomeHousing
Housing

Can people afford to live in North Meck?

Rents have risen twice as fast as incomes since 2018. Home values have nearly doubled. This section follows the data to show who is affected, where the pressure is highest, and what it means for the communities that make North Meck work.
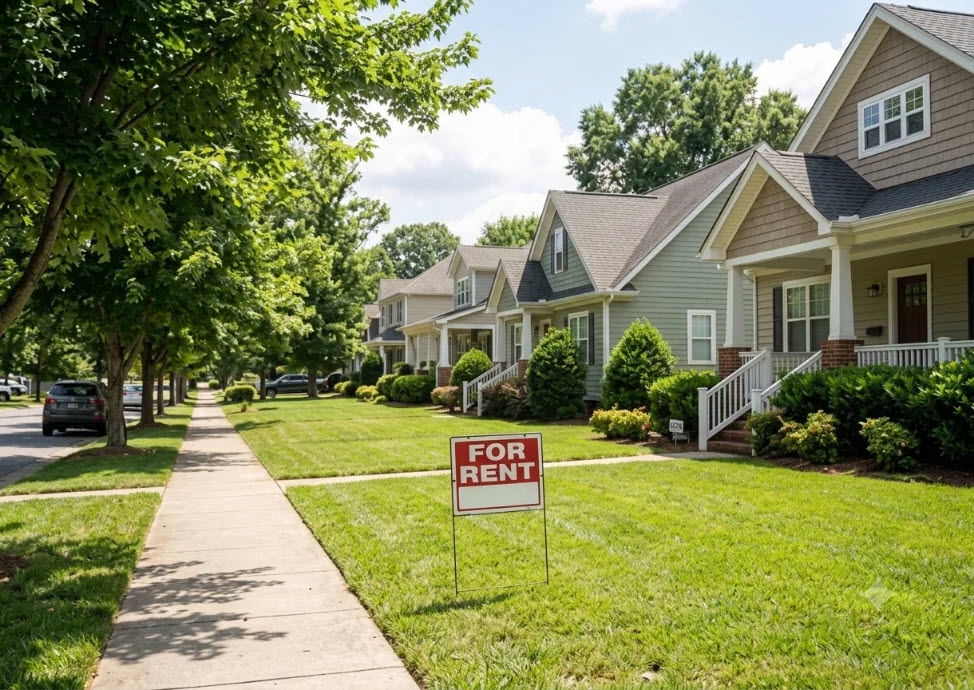
A North Meck neighborhood street with a For Rent sign
OverviewAffordabilitySupplyDisplacement RiskHomeownership & EquityIncome & Need
Area:All North MeckCorneliusDavidsonHuntersvillefilters every chart
52%

rent rise in Huntersville since 2018, from $1,196 to $1,820/mo

ACS 2018–2024
Median Rent by Town (2018–2024)
20+ yrs

of gross income to buy the median home, for a $20k–$35k household

ACS 2024
Years of Income to Buy the Median Home, by Bracket (2024)
$693k

median home price in Davidson, 4× the U.S. national median

ACS 2024
Median Home Value by Town vs. U.S. Median (2024)
U.S. median ~$179k
~10 yrs

to save a 20% down payment at a 10% annual savings rate

ACS 2024
Years to Save a 20% Down Payment, by Town (2024)
Assumes 10% annual savings rate on median household income
Affordability

How much does it actually cost to live here, and who can afford it?

How have rents changed across Davidson, Cornelius, and Huntersville?

Median rent by town, 2018–2024. Each line tracks what renters paid in that year's ACS survey.

Median Rent by Town (2018–2024)
Cornelius, Davidson, Huntersville
Town:
A two-bedroom in Huntersville that rented for roughly $1,196 in 2018 now goes for $1,820, a 52% increase. Rent rose fastest in Cornelius and Huntersville after 2020, while Davidson (already the priciest) saw slower growth from a higher base.
Source: ACS 2018–2024

How have home prices changed, and is buying becoming out of reach?

Home values indexed to 2018 alongside median income, showing how ownership affordability has shifted.

Home Value vs. Income Growth, Indexed to 2018
Home values have risen far faster than incomes, making ownership increasingly out of reach
Town:
In Cornelius, home values rose 91% between 2018 and 2024. Median incomes rose just 28% over the same period.
Source: ACS 2018–2024
Rent vs. Income Growth, Indexed to 2018
When the rent line rises above the income line, affordability is eroding · North Mecklenburg
Town:
In Davidson, rents rose 68% between 2018 and 2024 while incomes rose 37%. The gap is widest here, but every town shows the same divergence.
Source: ACS 2018–2024 · index set to 100 in 2018 so towns can be compared on the same scale regardless of starting dollar values

How much does someone need to earn per hour to afford rent without being cost-burdened?

The "housing wage" is the hourly pay a full-time worker needs so rent does not exceed 30% of income. No common local occupation reaches it.

Housing Wage vs. Most Common Local Occupations
Hourly wages for Charlotte-area occupations vs. the housing wage needed to afford a 2-bedroom without being cost-burdened
At $35.08/hr, the housing wage is out of reach for nearly every common occupation in the Charlotte area. Only registered nurses ($40.42/hr) earn enough — most workers in retail, food service, and logistics earn less than half the housing wage.
Source: NLIHC Out of Reach 2024 · BLS Occupational Employment & Wages, Charlotte-Concord-Gastonia MSA 2023
Fair Market Rent by Bedroom Size (2025)
HUD Fair Market Rents for Charlotte vs. Raleigh and Atlanta — how local rents compare across metro peers
Charlotte's Fair Market Rents are broadly comparable to Atlanta's and below Raleigh's for smaller units, but the gap closes — and reverses for 4-bedroom units — as family size grows. A 4-bedroom unit in Charlotte runs $2,852/month, $309 above Atlanta.
Source: HUD FY2025 Fair Market Rents

Who can afford to live in North Meck at different income levels?

Income limits and maximum affordable rent at each AMI bracket compared to fair market rent, showing the monthly gap households face at each income tier.

Affordable Rent vs. Fair Market Rent by AMI Bracket
Max affordable rent (30% of income rule) vs. HUD Fair Market Rent across bedroom sizes — Charlotte-Mecklenburg metro, FY2025
Households earning 30% or 50% of AMI face a severe monthly shortfall — they can afford far less than market rents require. Even at 80% AMI, most bedroom sizes remain out of reach. Only households at 100% AMI can afford the fair market rent for all unit sizes.
Source: HUD FY2025 Income Limits & Fair Market Rents · Charlotte-Concord-Gastonia HUD Metro FMR Area

How does rent — and homeownership — compare to what residents actually earn?

Rent-to-income ratio measures what share of median household income goes to rent. A home price-to-income ratio above 4× is considered unaffordable for first-time buyers without significant savings. Both ratios have climbed sharply since 2018.

Rent-to-Income Ratio by Town (2018–2024)
Median rent ÷ median household income · 30% HUD threshold shown
Town:
In all three towns, rent now consumes a larger share of household income than it did in 2018. The dashed line marks the 30% cost-burden threshold — once crossed, households have less to spend on food, healthcare, and savings.
Source: ACS 2018–2024 · ratio = (median annual rent) ÷ (median household income)
Home Price-to-Income Ratio by Town (2018–2024)
Median home value ÷ median household income · 4× threshold shown
Town:
All three towns have crossed the 4× home price-to-income threshold, meaning a median-priced home now costs more than four years of median household income — well above the historical affordability benchmark for first-time buyers.
Source: ACS 2018–2024 · ratio = median home value ÷ median household income
Supply

Is there enough housing in North Meck, and is it the right kind?

How fast is North Meck growing, and is housing supply keeping up with population?

Total population by town, 2018–2024. Rapid growth increases demand for all housing types, particularly affordable rentals.

Population Growth by Town (2018–2024)
Cornelius, Davidson, Huntersville
Town:
Huntersville added the most residents: its population grew by over 10,000 between 2018 and 2024. That kind of growth without matching affordable supply is a core driver of the cost pressure seen in the Affordability tab.
Source: ACS 2018–2024

How many households are in each town, and how has that changed?

Total Households by Town (2018–2024)
Town:

Loading data…

Owner-occupied households dominate all three towns (70–80% of households), but Huntersville has added the most renter households in absolute terms since 2018, reflecting its rapid growth.
Source: ACS 2018–2024

What is the mix of single-family, multifamily, duplex, manufactured, and condo units?

Housing Types by Town (2024)
Share of housing units by structure type
All three towns are majority single-family, but Cornelius has the highest share of large multifamily (25%), reflecting its denser, more transit-accessible development pattern.
Source: ACS 2024 · Table B25024
Displacement Risk

Who is at risk of losing their housing, and where is the pressure greatest?

What share of renters in each town spend more than 30% of income on housing?

Cost burden broken down by income bracket and tenure. Davidson has the highest severe burden rate (27%) despite its highest median income, likely driven by a small renter population that skews low-income.

Cost Burden by Income Bracket
Households by housing cost burden level · North Mecklenburg
Town:Tenure:
Nearly all renters earning under $20k are severely cost-burdened, spending more than half their income on housing.
Source: ACS 2024 · CHAS via HUD
Renter Cost Burden Rate Over Time
Share of renter households spending 30%+ of income on housing · 2018–2024 · North Mecklenburg
Show:

Loading data…

In Cornelius, the share of cost-burdened renters rose from 28% in 2018 to 46% in 2023, nearly doubling in just five years.
Source: ACS 2018–2024

Is cost burden getting better or worse over time?

Trend in burden rate, household count, and severe burden since 2018. 2020–2021 marked the COVID-era eviction moratorium period.

How many renter households are at high displacement risk?

Severely cost-burdened households (50%+ of income on rent) have less than half their income left after housing. They are one unexpected expense away from eviction.

Severely Cost-Burdened Households by Town (2018–2024)
Households spending 50%+ of income on housing
Town:

Loading data…

Severely cost-burdened households have less than half their income left for food, healthcare, transportation, and emergencies, just one unexpected expense away from eviction.
Source: ACS 2018–2024

How many North Meck households are financially vulnerable but invisible to traditional poverty measures?

The Federal Poverty Level (FPL) was designed in the 1960s and does not account for regional cost differences. In North Meck, where costs are high, the FPL misses a large share of struggling households. The ALICE framework (Asset Limited, Income Constrained, Employed) fills this gap.

"Standard poverty data makes it look like North Meck doesn't need services. ALICE shows the real picture."
— Diane Means, Ada Jenkins Center · Davidson West
ALICE Households and the Hidden Gap
Below FPL / ALICE / financially stable, most recent year · Mecklenburg County

Loading data…

Source: United Way NC ALICE Report, Mecklenburg County · unitedforalice.org
Homeownership & Equity

Who gets to build wealth through homeownership, and who is locked out?

Is there a racial gap in homeownership, and has it widened or narrowed?

Nationally, the Black-white homeownership gap is larger today than it was before the Fair Housing Act. North Meck's own numbers tell a local version of that story.

Homeownership Rate by Race & Ethnicity
Owner-occupied households as share of all households by group · North Mecklenburg
View:
Town:
White residents own at 73–82% across the three towns. Black residents own at 29–62%, a gap that reflects decades of structural barriers to wealth-building.
Source: ACS 2024 · Census tenure by race

Loading data…

53% of Black renter households are cost-burdened, compared with 37% of White renter households. One in ten Hispanic households lives in overcrowded conditions.
Source: ACS 2024

What is the racial makeup of each town today?

2024 population share by race/ethnicity across the three North Meck towns.

Population Share by Race (2024)
Share of total population by race/ethnicity
Town:

Loading data…

Huntersville is the most diverse town, with Black residents at 13.6% and Asian residents at 6.4%. Cornelius and Davidson both remain over 80% white.
Source: ACS 2024

How has the racial composition of each town changed since 2018?

Demographic change shapes who can access homeownership and who gets displaced. Rising prices pull in higher-income, whiter households while pushing out lower-income residents of color.

Racial Composition by Town (2018–2024)
Share of total population by race/ethnicity
Town:
Race:
North Meck's towns are becoming more diverse, but at very different rates. Huntersville's Black population has grown significantly since 2018, while Davidson remains predominantly white. Tracking these shifts matters for equity in housing access.
Source: ACS 2018–2024
Years to Save for a 20% Down Payment, by Town
Assumes 10% annual savings rate on median household income

Loading data…

At current prices, a household earning the median income would need nearly a decade just to save for a down payment, assuming they save 10% of gross income every year with no competing savings goals.
Source: ACS 2024 · formula: (median home value × 20%) ÷ (median income × 10%)

What does it take to buy a home at different income levels?

Years of gross income needed to buy the median home, by income bracket and town. The lower-income brackets reveal the true scale of exclusion: a household earning $20k–$35k would need over 20 years with nothing spent on anything else.

Years of Income to Buy a Home, by Income Bracket
Median home value ÷ income bracket midpoint, showing how many years of gross income to buy
Town:
A household earning $20k–$35k would need over 20 years of gross income to buy a median home in any North Meck town, with no money spent on anything else.
Source: ACS 2024
Income & Need

What do residents earn, and does it reflect true financial vulnerability in North Meck?

Standard poverty measures miss a significant share of struggling households here. This tab explains why, and shows what the data actually reveals.

Why we show ALICE alongside traditional poverty data: The Federal Poverty Level (FPL) was calculated in the 1960s based on food costs and hasn't kept pace with housing, childcare, or healthcare. In wealthy suburbs like North Meck, it makes need nearly invisible. ALICE (Asset Limited, Income Constrained, Employed) measures households that earn above the FPL but still can't cover basic costs — the households who need services at places like the Ada Jenkins Center in Davidson West.
This is a methodological transparency note, not a political statement. Every data choice on this portal is documented.

What is the income distribution across North Meck's three towns?

Median household income by town over time. The high medians conceal wide variation: income inequality within each town is substantial.

Median Household Income by Town (2018–2024)
Cornelius, Davidson, Huntersville
AllCorneliusDavidsonHuntersville
Davidson's median household income rose from $117k in 2018 to $156k in 2024, but the high median conceals a wide gap: the Gini data shows income inequality within Davidson is growing alongside that headline number.
Source: ACS 2018–2024

How unequal is income distribution within each town?

The Gini coefficient measures income inequality: 0 = perfect equality, 1 = maximum inequality. Cornelius (0.52) has significantly higher inequality than the national average (~0.40), meaning the gap between its wealthiest and most financially vulnerable residents is unusually wide.

Home Price-to-Income Ratio Over Time
Median home value ÷ median household income, years of income to buy
Town:
Davidson's PTR jumped from 3.3× in 2018 to 4.1× in 2024. A ratio above 3× is widely considered unaffordable for first-time buyers. Cornelius went from 3.2× to 4.8×, the steepest rise in North Meck.
Source: ACS 2018–2024
Income Inequality Over Time (Gini Coefficient)
0 = perfect equality · 1 = maximum inequality
AllCorneliusDavidsonHuntersville
Cornelius has seen the sharpest rise in inequality: its Gini coefficient climbed from 0.48 in 2018 to 0.53 in 2023, approaching levels seen in major cities. Inequality in Cornelius now far exceeds the national average (~0.40).
Source: ACS 2018–2024

How many North Meck households are financially vulnerable but above the federal poverty line?

The ALICE gap is the share of households earning above the FPL but below the ALICE Threshold — the minimum cost of living for housing, food, childcare, transportation, healthcare, and technology. In North Meck, the FPL alone drastically undercounts who is struggling.

Household financial stability by town (latest year)
Below FPL · ALICE · Above ALICE threshold
AllCorneliusDavidsonHuntersville
The FPL was designed in the 1960s and does not account for the true cost of living in high-cost suburbs. ALICE households earn above poverty but still can't cover basics — making them invisible in traditional need measures.
Source: ALICE Report · United Way
North Meck vs Mecklenburg County (latest year)
Share below ALICE threshold · towns vs county benchmark
Comparing North Meck towns to Mecklenburg County as a whole reveals whether suburban wealth conceals vulnerability relative to the broader county population.
Source: ALICE Report · United Way
Combined share below ALICE threshold by town
Poverty + ALICE households as % of all households · latest available year
Nearly one in four households in each North Meck town earns above the federal poverty line but still cannot cover basic costs — making them financially invisible in most need measures. Multi-year trend data will be added when available.
Source: ALICE Report · United Way

Who lacks access to cars, internet, and health insurance?

Select a metric below to see how it varies across towns over time. Renters are consistently more likely than owners to lack a vehicle — a significant barrier in a car-dependent suburb.

Access Gaps by Town (2018–2024)
One metric at a time
Metric:
Households without broadband face higher barriers to remote work, telehealth, and benefit enrollment. Renters — who are also more likely to lack a car — face a compounding access gap that standard poverty measures don't capture.
Source: ACS 2018–2024

How does educational attainment relate to poverty and employment across towns?

High average attainment conceals real pockets of poverty and unemployment. Select a metric to see how each town compares.

Education & Economic Mobility by Town (2018–2024)
One metric at a time
Metric:
High average education attainment across North Meck coexists with meaningful poverty and unemployment pockets — a reminder that townwide statistics can mask significant variation within each community.
Source: ACS 2018–2024
Take the data with you
Every chart is available as CSV. Full methodology in the 2026 report.